The 10 payment KPIs every e-commerce merchant should monitor.
It is crucial for merchants to be able to monitor and understand their payment data. However, as we have already covered, this can be incredibly complicated.
We know from experience. Our founding team has spent more than a decade helping 100-plus merchants optimize payment monitoring, define KPIs and analyze payment performance.
In this post, I want to share what we have learned from that experience. Below are 10 KPIs that any good payment strategy should track, and how to calculate them.
An important note before we begin: For some of these metrics, you might want to decide beforehand what timeframe you will base your calculations on.
1. Authorization rate/conversion rate
The authorization rate is a basic KPI that every payment manager will look at on a daily basis. It tells you the percentage of payment authorization attempts that were successful over a given period of time.
How to calculate authorization rate: Divide successful authorizations by the total number of authorizations. Often, it’s useful to measure specific authorization types (e.g. standard authorizations, zero auth, reauthorizations, retrials). The calculation for those is the same. For standard authorizations, you divide the number of successful standard authorizations by the total number of standard authorization attempts.
What does this KPI tell you?: How well a merchant’s payment system is performing. When authorization rates dip, that means a higher number of payment attempts went unauthorized. When legitimate payment attempts go unauthorized, customers get frustrated and sometimes take their business elsewhere. So, there is a strong correlation between authorization rate and merchant revenue.
What else should merchants know?: For alternative payment methods, you often see “conversion rate” used instead of “authorization rate.”
2. Issuer declines
For card payments, it’s important to track the number of issuer declines regularly. When you notice an overall increase in declines, look to see whether issuer declines trend in the same direction. Usually, this is the case. How to find issuer declines data: Your payment data will give you this figure.
What does this KPI tell you?: Issuer declines are like the Check Engine light in your car. If you see an uptick in issuer declines, something somewhere is happening with your payment system, though it’s not always clear what. It’s a call to investigate further.
What else should merchants know?: In the past, issuer decline data have been pretty opaque. Merchants everywhere know the frustration of seeing the “do not honour” reason code attached to an issuer decline, which tells them nothing about why a given payment or a given card was declined. Over the past several years, card schemes have tried to give new clarity to declines by introducing new programs and new reason codes.
3. Gateway failures
When you see an increase in declines, look to see whether there’s a corresponding uptick in gateway failures. Very often, this is the case. How to find gateway failures data: No math here, again. Your payment data will have this figure.
What does this KPI tell you?: That something is happening upstream from the issuing bank. Sometimes, it just means that people are trying to pay with cards from a country that the acquirer doesn’t accept. Sometimes, it means there has been a bad request, a merchant timeout or that the merchant has breached a payment protocol (e.g. by trying to capture an authorization after the allowed timeframe).
What else should merchants know?: As with issuer declines above, an uptick in gateway failures won’t tell you a complete story. It’s a sign that you need to investigate further.
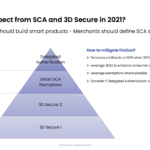
4. 3-D Secure conversion and challenge rates
Today, many countries require Strong Customer Authentication (SCA) by law. The Payment Service Directive 2 (PSD2) in Europe, for example, makes SCA mandatory for EU merchants. Card schemes offer 3-D Secure (2.3 is the latest version) as a way to comply with SCA requirements and offer an additional layer of payment security.
How to find your 3-D Secure conversion and challenge rates: Divide the total number of 3DS successfully authenticated transactions by the total of 3D Secure transaction requests.
What do these KPIs tell you?: Whether 3DS authentication friction impacts payment performance and merchant revenue. That’s why it’s important for merchants to track their 3DS authenticate rates as well as performance when a customer is presented with a challenge from their issuing bank.
5. SCA exemption success rate
PSD2 SCA requirements have added complexity for merchants, and they have created new ways to optimize payment performance and offer smoother customer journeys.
A key optimization point is within SCA exemptions, specifical exemptions for low-value transactions and exemptions for low-risk transactions. You’ll see those exemptions referred to as LVP (Low-Value Payments) and TRA (Transaction Risk Analysis).
How to find your SCA exemption success rate: Divide the total number of successfully exempted transactions by the total of SCA-exempted transaction requests.
What does this KPI tell you?: How well does your exemption strategy perform against issuing bank decisions. For example, you can track TRA exemptions across different issuers to see whether some perform better than others. The same goes for LVP exemptions. If certain issuers excel over others, then this reveals a possible way to optimize your exemption settings.
6. Declines due to risk
As long as digital payments exist, fraudsters will keep fraud and payment managers very busy. Fraud and chargebacks are part of the game, and so part of building a payment system is finding the right balance between security and customer experience.
How to find risk declines data: Divide the total number of transactions declined due to risk by the total of transactions screened by your fraud engine.
What does this KPI tell you?: If you see an uptick in risk declines, or if your declines are above industry benchmarks, your fraud management strategy could be leaning too far toward security — and harming your customer experience.
7. Chargeback rate
The chargeback rate will tell you the percentage of successful sales that get charged back. As with the refund rate above, if this number ticks upward sharply a prompt response is warranted.
How to calculate chargeback rate: Divide total number of received chargebacks that are linked to a successful sale by the total number of successful sales. This calculation should be done within the bounds of the date of the original sale.
What does this KPI tell you?: Again, chargeback rate allows you to compare payment channels side-by-side. An increase in chargeback requests in a given channel means there could be a technical problem, or there could be fraud occurring.
What else should merchants know? Chargeback rates are also useful to monitor so that you don’t end up entering a scheme program.
8. Fraud rate
Chargebacks and fraud sometimes go hand in hand, but not always. That’s why it’s important to track fraud rates separately.
How to calculate fraud rate: Divide the total number of fraud alerts (TC40/SAFE) received that are linked to a successful sale by the total number of successful sales. This calculation should be done within the bounds of the date of the original sale.
What does this KPI tell you?: This is another way to measure the performance of each payment channel. When fraud rates spike on one channel relative to the others, it’s time to investigate what’s happening.
What else should merchants know? Fraud rates are also important to monitor so you don’t end up entering a scheme program.
9. Refund rate
Refund rate will tell you the percentage of successful sales that get refunded. If your refund rate ticks upward sharply, a prompt response is warranted.
How to calculate refund rate: Divide total refunded transactions that are linked to a successful sale by the total number of successful sales. This calculation should be done within the bounds of the date of the original sale.
What does this KPI tell you?: Refund rate is important to monitor for several reasons. For example, it can alert you to possible abuse among affiliate sellers, or to problems with a buy now, pay later channel (where returns are usually much higher anyway).
What else should merchants know?: Refund rate helps you compare your payment channels. If you have seven payment channels with similar refund rates and one payment channel with a wildly different rate, then that’s an indication something is going wrong with that payment channel.
10. Fees
Merchants don’t typically monitor fees at a granular level due to data complexity. We think this is a mistake. We believe it is important to have a full overview of what you are paying, and how those fees get split among payment methods, merchant accounts and whichever countries take their cut.
How to calculate fees: Your payment data should have this information, though it may require some additional calculation to understand what money goes where. Take your reconciliation and settlement files to derive the KPIs.
What does this KPI tell you?: How much you’re paying to process payments. When you know, for example, whether a processing fee, a scheme or an interchange fee is a primary driver of your payment costs, you can negotiate with payment service providers with more clarity and confidence. That way, you ensure payment costs are aligned with your expectations.
Monitoring your KPIs and establish reporting is never easy nor straightforward. When you are starting to implement new methodologies for your business it is fundamental to have the right knowledge and set of skills. At Payment-Universe our team of payment experts has more than 50 years of combined payments experience to support you establishing the right monitoring and reporting activities.